A Quick Introduction to the Network log.

Author : Narhari Kale.
Published On : 13-Aug-2021
The Chrome dev tool is very useful for debugging, Network diagnosis, and app performance. We may also use it as a code editor to write, cut, copy and paste HTML elements. It also provides some features to check responsiveness for mobile or small display size devices.
There are many topics in each tab that we can write a blog on each of those. The network tab also has many sections, but we are covering only Network log. A network log is a section in the Network tab where it logs all network activity. In this blog, we are answering the following questions.
What is network log
It is a section in the network tab which shows all the Network resources that are requested. It's in a row and column format. Each row has individual network resources and the column shows additional resource information.
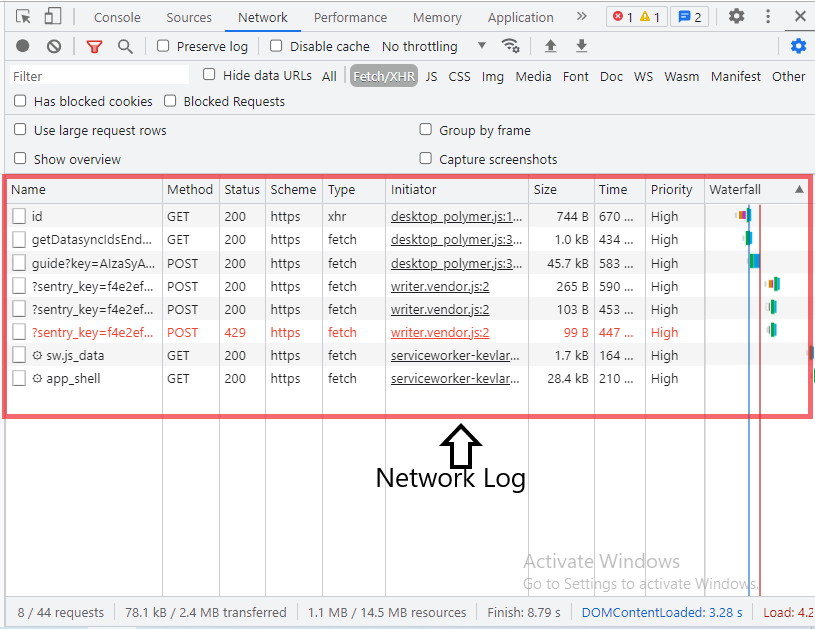
You can open dev tools by pressing "ctrl + shift + J" for windows and then click on Network tab. The red region of the above image displays the network log. Which consists of rows and columns. Each row displays a single network resource that is requested and a column represents the information related to this resource.
Headers of Network log
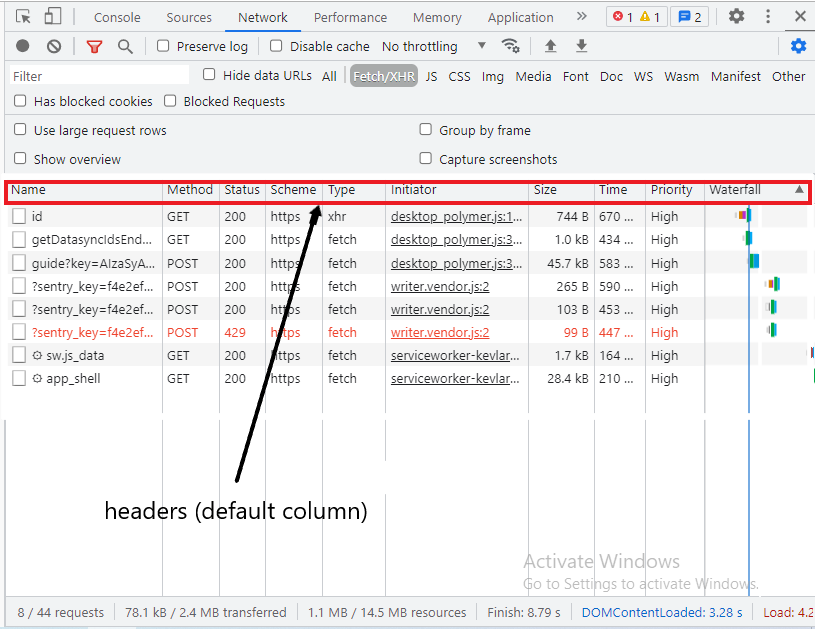
The network log is made up of the following default columns: Name, State, Type, Size, Time, Initiator, Waterfall. There are a lot more headers but they are hidden. This can be found by right-clicking on the header.
Inspect single resource
Click any resource in the Name column and it opens a new tab. This tab consists of Network headers, preview, response, initiator, and timing. We will discuss them one by one, with respect to the last resources.
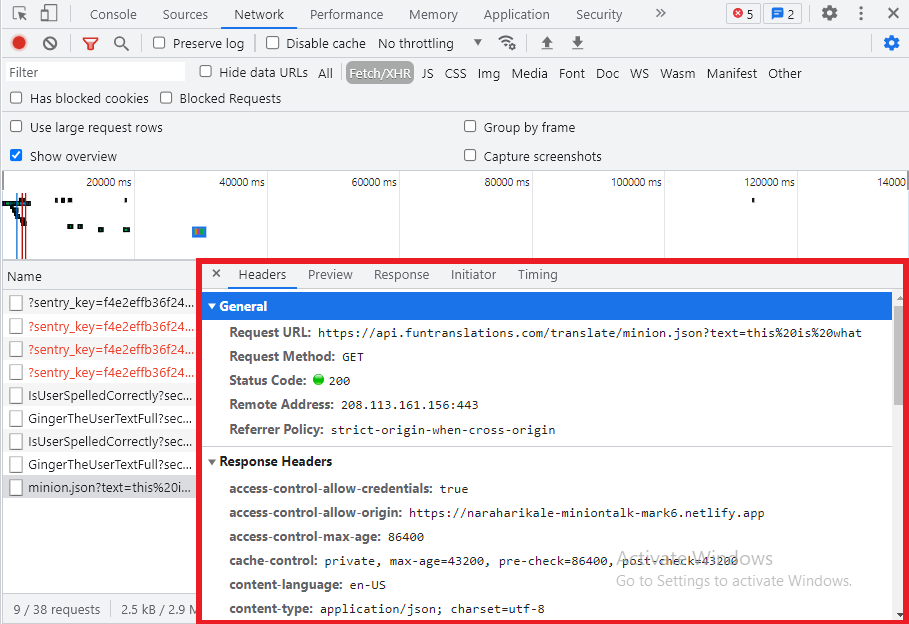
We are inspecting the last resource in the above image, so it shows more info about that resource.
To get a better understanding, you can experiment with this demo
The Chrome dev tool has plenty of concepts to learn, we've just covered only a few of them. If you come across any mistakes(errors) or want to provide feedback,please free to DM 👇.